


Contents
- Graphic presets
- Resolution scaling
- Fast and slow frames
- Lategame slowdown
- High resolution slowdown
- Game speed
- Other testing
- Test setup
- Final comments
This post will look more closely at system performance in StarCraft II. I will go over the performance of different graphical presets, resolution scaling, frametime distributions, bottleneck cases, game speed, Vsync, etc. Tests were run on a four-minute replay segment. Replays are good for getting consistent results, however, your own performance will depend on what exactly is happening in-game, and your hardware/software configuration.
Basic terms
- Frame = a picture to be displayed on screen
- Frametime = time between frames (lower is better)
- FPS = frames per second = framerate (higher is better)
- 1% low FPS = framerate where 99% of frames are faster, and 1% are slower (higher is better)
- 0.1% low FPS = framerate where 99.9% of frames are faster, and 0.1% are slower (higher is better)
1. Graphic presets

The most significant performance regression is between Low and Medium presets. However, it's also accompanied by a big improvement in visual quality. Another significant jump is between High and Ultra presets. I tried hybrid settings (version 3.0). Performance-wise it was between Low and Medium presets, but I was getting graphical errors, and 0.1% lows suffered from it.
In figure 2 are individual graphic settings that were impactful in this benchmark. Their performance is shown as relative to High preset. Different settings will have a different impact based on particular game sequence, but these should be representative of normal gameplay. Terrain and Reflections settings had no measurable impact, but this benchmark had very little creep or water shown, so results may vary. Ultra textures didn't have a measurable impact under normal conditions (while not bottlenecked by VRAM or GPU memory bandwidth).

2. Resolution scaling

We see that resolution doesn't affect performance on Low graphic preset. This indicates that the game is not GPU limited, and is being limited by CPU/RAM performance. For High graphic preset there is a drop after 4Mpx (2560x1600) which doesn't happen on Low. We are running into some GPU bottleneck (see section 5). The exact spot where you run into a GPU bottleneck will be different for each GPU (RX 480 used here).
~ ~ ~
The following sections will look at frametime distributions, various slowdowns, and try to make sense of it. Feel free to skip to the section 7 for other testing, test setup and final comments.
3. Fast and slow frames
First we might want to look how frametimes usually look like. The following example is from a first-person-shooter game: Metro Exodus (fig. 4). Notice that frametimes are mostly clustered closely together (spread < 2ms). Changes in this distribution are from moving the camera and showing a different scenery with different complexity.

Now let's look at our benchmark run in StarCraft II (fig. 5).

We can see there are two types of frames. One type is faster and clustered more tightly – I will call them "fast frames". The other type is slower and more scattered – "slow frames" (fig. 6).

Let's look closer (fig. 7).

Upon closer examination we might realize that slow frames come every ~45ms. This corresponds to the length of game ticks on the faster games speed (16 ticks per ingame second; 22.5 per real second; 44.4ms interval). It seems that the game delays creating new frames until it's done calculating the next game state (game simulation). Slow frames are those delayed frames.
This leads to inconsistent frametime pacing. However, given the nature of FRAPs measuring (see section 8), some uneven frametime pacing will get smoothed out in the final output. This is likely the case for some but not all slow frames. If slow frames are fast enough, frames will still get delivered to the display at a steady rate, and only animation smoothness will suffer.
~ ~ ~
The following figure shows how the game seems to work. I wrote "render" here, but the CPU is only pre-rendering frames, which can still take a significant amount of time. This is a very simplified diagram showing only the application part of rendering pipeline (see section 8). The game is also doing other work (e.g. sound, connectivity, and other foreground and background tasks).

This is not an ideal situation because we are not bottlenecked by either the game simulation or other tasks, instead these two workloads slows one CPU thread together. This means that the performance in heavy lategame battles is still affected and slowed by higher graphical settings. You would expect that the game would be bottlenecked solely by the game simulation, and be unaffected by graphical settings, but that's unfortunately not true.
I expected to see something like in figure 9. They already went to great lengths to make the game simulation deterministic and separate from anything visual. It has to be completely deterministic and synchronized between players. It's independent of what is being shown. For example the game logic cannot ask about a unit actor (its looks, animations, sounds, etc). The logic has to be deterministic; but the actor, belonging to non-deterministic visual side, might be doing different animations for different players or not exist at all. Despite that these workloads seem to be processed on the same thread.

Pausing the game
Pausing a replay is interesting because it essentially stops only the game simulation. As you would expect, only slow frames disappear as they are a combination of the game simulation and other tasks (fig. 10). The variation in fast frames is from moving the camera.

Zoom out
Another simple test is to zoom out camera far out in a custom map (fig. 11). The complexity of the game simulation will stay the same, but the complexity of the visual side will quickly increase as more objects fill up the screen. We see that slow frames are nicely following fast frames up – supporting the idea that slow frames are a combination of the game simulation and other tasks.

Different graphic presets
If we look how frametimes are distributed in different graphic presets (fig. 12), we see that Low preset has the fastest fast frames, and fast and slow frames are nicely separated and form two peaks.
In Medium and Extreme presets frames are more mixed together as fast frames take longer to pre-render. Both High and Extreme have considerably more slow frames (right tails of their distributions) which reflects in lower 1% and 0.1% FPS. This is again given by the fact that slow frames are a combination of the game simulation and other tasks.

4. Lategame slowdown
The performance regresses if the game simulation becomes more complex (bottleneck on CPU/RAM). In the following example (fig. 13), we see slow frames taking a hit in complex parts of the game simulation – destroying a train and a big fight following it. In this case slow frames become even slower, and there are fewer fast frames in-between. This leads to reduced FPS.

The following example shows even more demanding segment that wasn't a part of this benchmark run.

A – Fast frames are
present until slow frames take ~45ms (~36 FPS with 1:1 fast-slow ratio).
B – This is followed
by few slow frames without fast frames (~22 FPS).
C – After slow
frames reach ~47ms, the game tries to stabilize by creating just one frame
per two game ticks (~90ms; ~11FPS) (fig. 15).
In this case this is enough, and the game will just have less FPS (~11 FPS); the game speed didn't change. But this drop to 11 FPS could have been completely prevented if the game simulation ran in parallel to the visual side.

If the simulation was even more complex, if game ticks took more than ~45ms for one player, the game would have to slow down for all players to stay synchronized (fig. 16).
Here the game behaves very differently. We can again see both slow frames and fast frames, which have previously disappeared in demanding sections. However, scales in this figure are very different to what we have seen before. The distance between slow frames is now ~1000ms (45–90ms before), and their peaks are over 400ms (15–90ms before). In this test the game was about 2–3 times slower, and became "choppy" – updating only with each slow frame (every few seconds).
It's very interesting that we see fast frames again. Perhaps it runs in parallel after all, or the game simulation is running into a different bottleneck.
Note that in fig. 14, the game dropped to 11 FPS, but the game speed wasn't affected. 11 FPS was representative of the game performance. In figure 16 the average is actually ~20 FPS despite the game slowing down and being very choppy. This is thanks to the return of fast frames; and it shows how average FPS isn't always the best indicator of the experience you get.

In figure 17 we see yet another interesting behavior. This was done on a local test map with ~200 Zerglings constantly attacking 8 Nexuses for about 4 minutes. Nexuses were given enough HP to survive, and the game didn't evolve in any other way. Despite the game state being very similar from moment-to-moment, the performance got progressively worse. The game went from being very smooth with high FPS, to slowing doing and low FPS.
This indicates that the performance depends on its history and not only on the immediate game state. It also means that prolonged slowdowns will be even worse. Pausing and unpausing the game had no effect, however, stopping Zerglings from attacking for a split-second successfully restarted this scenario.
Surprisingly during this whole test fast frames never disappeared. I expected to see an intermediate stage with fast frames being removed as on figure 14, but that wasn't the case. So perhaps we are looking at different types of bottlenecks for the game simulation.

5. High Resolution slowdown
Let's move from the game simulation bottlenecked, and look on the GPU. In my test I experienced performance degradation on the High preset at 3840x2400 (2400p). VRAM usage was still good (3.2 GB out of 8 GB), as were temperatures which suggests it wasn't a bottleneck in raw shading power. But frametimes were all over the place (fig. 18).

Let's look closer.

We can clearly see frames in-between fast and slow frames. That alone doesn't tell us much, so let's compare 1200p and 1600p on the High preset; and see if we can find some of these frames appearing in 1600p.

In highlighted areas 1 and 2, we might see these frames appearing with 1600p resolution. If we look in-game, these areas correspond to scenes with heavy alpha effects (with transparencies) occupying large parts of the screen (fig. 21).
This points to the game saturating GPU memory bandwidth. If we look at GPU-Z, we see memory controller spiking close to 100% utilization (normally it stays low). 2400p has more than twice the number of pixels than 1600p, which pushes GPU memory bandwidth even more and causes a noticeable drop in performance. Reducing texture quality slightly improves this situation.

6. Game speed
For normal speed, the main difference is that game ticks happen each 62.5ms instead of 44.4ms on faster speed. This benchmark was run on a different scene for a fixed game time (1920x1200, low). It has a very nice separation of fast and slow frames (fig. 22). Slow frames take the same amount of time on normal speed; and the game only renders more fast frames in-between.
On normal speed you get higher FPS (average, 1% and 0,1% lows) because you have more fast frames. But you might run into frame pacing issues at the same points since those mainly depend on slow frames alone. Other things will improve. Both losing fast frames (fig. 14), and slowing down of the game speed (fig. 16) will be better thanks to the simple fact that you have 18ms more between game simulation ticks.

7. Other Testing
I have done few other tests on Low preset with ultra textures.
Frametime Spikes
In all runs there are frametime spikes (40+ ms), sometimes reaching over 100ms. Some of them are caused by the map script, for instance wave creation can cause a noticeable but temporary slowdown. These spikes will have fixed position in test runs. There are also spikes without fixed positions that do not persist between runs. One time I got ~50ms spikes every 21.5 real seconds. This might be related to GPU, for example to texture streaming. Originally, I though some of these spikes would be from switching camera position, but the impact of that was nowhere as big.
Windowed fullscreen
There was no measurable impact (1920x1200, low). Windows forces some sort of Vsync without actually limiting framerate, so it might introduce additional latency.
Vsync
Vsync prevents frame tearing by synchronizing the frame rate of the game with the monitor refresh rate for better image stability.
Here Vsync introduces a lot of frames in the middle at 16.6ms (60FPS) (fig. 23). And while the game should be able to deliver vast majority of frames at this rate (fig. 5), it will also introduce a lot of very slow frames (22–30 ms). On average, it does deliver 60FPS, but frametime pacing is inconsistent. The final output you see onscreen will likely look better than this. However, even if it does manage to deliver solid 60FPS to display, animation smoothness will suffer, and there will be additional latency penalty.

Metro Exodus with Vsync for comparison (fig. 24).

I tried limiting FPS in variables.txt (frameratecap=60), but the result isn't much better (fig. 25).

8. Test Setup
- GPU: Gigabyte RX 480 G1 Gaming 8GB (19.7.5 driver)
- CPU: R5 3600 (6C12T @4.2Ghz)
- CPU Cooler: Scythe Mugen 5 Rev.B
- Motherboard: B450 MSI Tomahawk (7C02v1A bios)
- RAM: 2x16 GB Kingston HyperX Predator 3333 Mhz CL14 (Hynix CJR)
- Storage: ADATA SSD XPG GAMMIX S11 480GB (OS + StarCraft II)
- OS: Windows 10 Pro (build 1903)
- StarCraft II: 4.10.1.75800 (64bit)
- Display: 1920x1200 @60 Hz
Testing:
A replay was benchmarked from 13:00 for 4 real time minutes. Vision from
set player 1, faster game speed and resolution of 1920x1200 unless noted
otherwise.
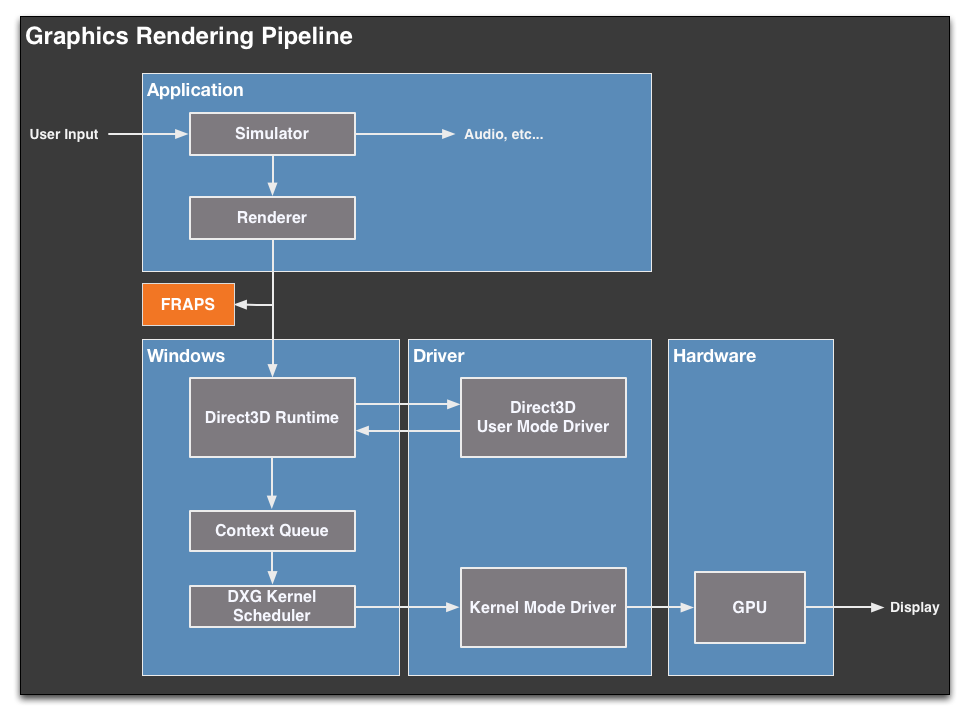
FRAPS was used to capture data about frametimes. It's position at the start of rendering pipeline (fig. 26) makes it good at exploring what goes in the rendering pipeline (what the game does), but will not accurately tell you how frames come out of the pipeline. It describes well things like animation smoothness.
Frame Capture Analysis Tool (FCAT), which is at the end of rendering pipeline, would give us a better idea of how smaller frametime spikes affect the delivery of frames; for instance fast and slow frames (fig. 3) or Vsync (fig. 23).
9. Final Comments
The performance of StarCraft II is very interesting. The most important takeaways are how graphic presets scale (fig. 1), and that the resolution has no impact on performance unless you hit some GPU bottleneck at high resolutions (fig. 3). StarCraft II is mainly bottlenecked by CPU/RAM performance on a single thread by both the game simulation and other tasks together. This is why higher graphic presents will always slow down the performance.
I will stick to playing on the low preset and ultra textures as this combination gives you the best performance. Ultra textures provide more details, and for instance on the last week's mutation (Void Rifts + Aggressive deployment) made Void Rifts significantly easier to see on the minimap (fig. 27). And lower shader settings make Afraid of the Dark mutator a bit easier (fig. 28).


For other testing it might be interesting to see the difference between Nvidia and AMD GPUs, as Nvidia has better multi-threaded driver for DX 9-11. I also wanted to test RAM scaling speed, but this was already a lot of testing, and RAM speed would also affect AMD's Ryzen Infinity Fabric speed, so results couldn't be extrapolated for Intel CPUs. Regardless of that, RAM performance (speed & memory timings) is important as shown in figure 29 (different benchmark run; timings from DRAM calculator for Ryzen).

INTERESTING links to check out


