


In this post I will go over some data from the recent StayAtHomestory Cup #1 event (April 10–11, 2020, Liquidpedia link). Data were gathered from the released replay pack (168 replays, 4 missing). All charts are from my webpage that's now moved to analysis.maguro.one.
Game length
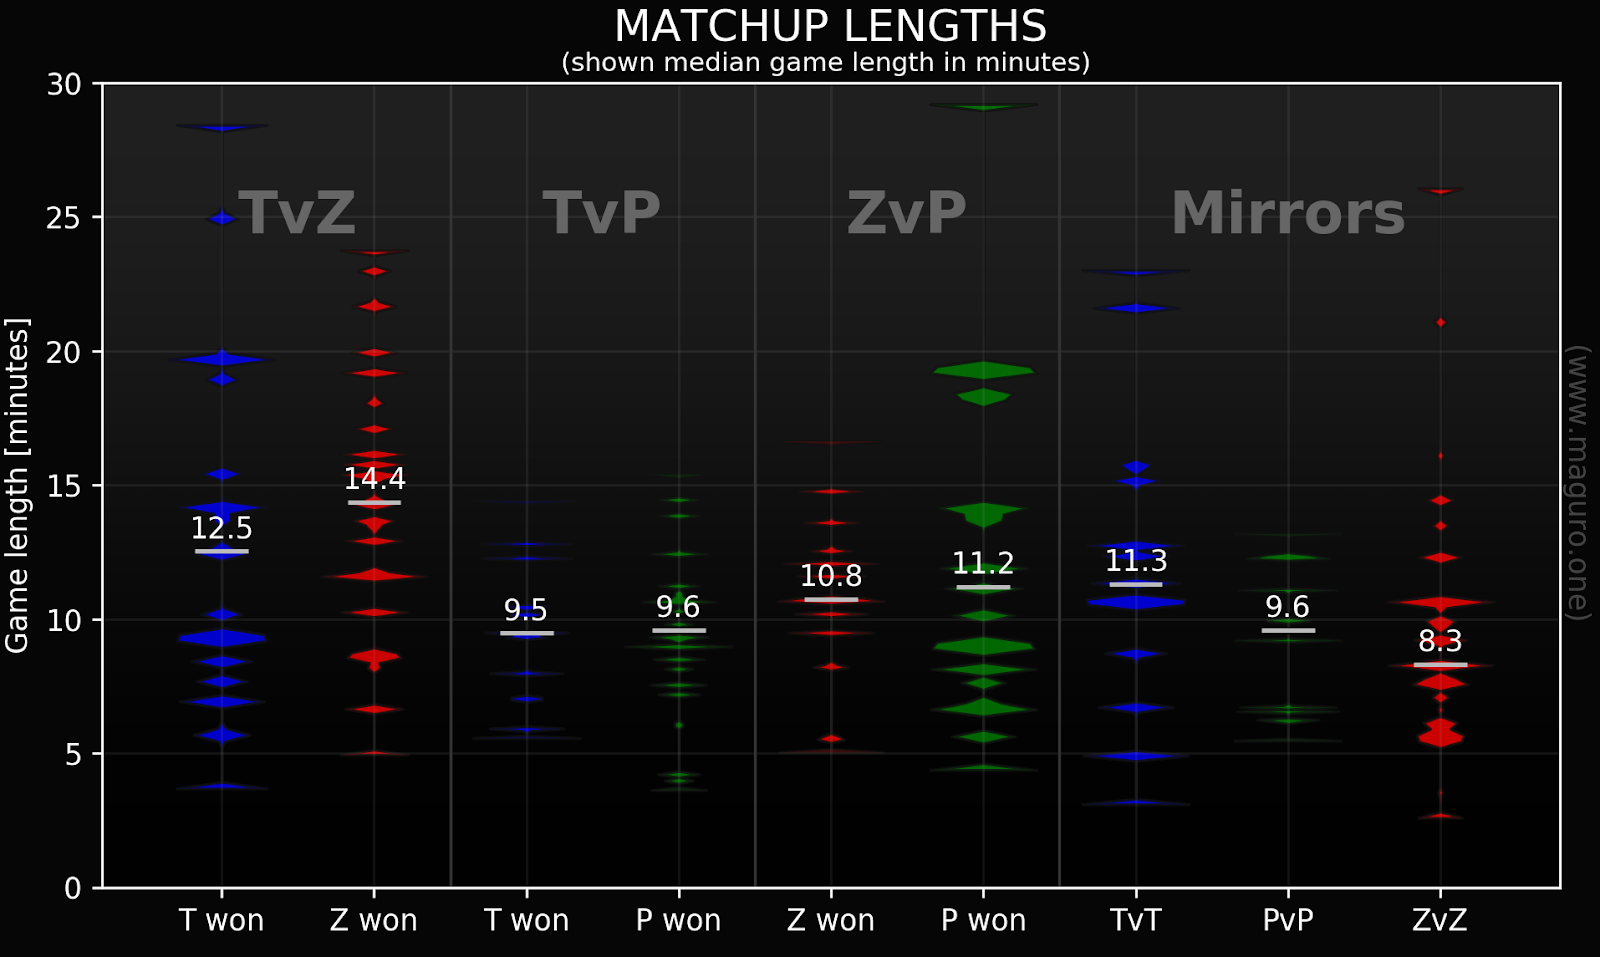
There were 47 TvZ, 35 PvZ, 35 TvP, 32 ZvZ, 13 TvT, and 10 PvP games. Compared to the IEM, we had longer TvZ games by ~2 minutes no matter which side has won. TvP games were shorter by about a minute. TvTs were shorter by ~4 minutes. ZvP, PvP and ZvZ games had roughly the same lengths.

(map counts were corrected for missing replays)
Hero units
Dream's Battlecruiser has killed 3175 resources worth of Serral's units (3 Overlords, 6 Roaches, 5 Corruptors, 3 Ravagers, 11 Zerglings, Creep Tumor, Locust, and a Nydus Worm). The game was played on "Simulacrum LE" (Twitch VOD).

Straight into the action

Numerous adventures

Full story and his fate here (imgur gallery)
Serral's Spore Crawler has killed 2750 resources worth of Soo's units. The game was played on "Purity and Industry LE" (Twitch VOD). This Spore Crawler never imaged it will be the best performing Zerg unit in the tournament – killing whopping 5 enemy Brood Lords. It lived happily ever after, guarding the expo with the sense of pride and accomplishment.

Pew pew
DnS's Colossus has killed 2125 resources worth of Soul's units (2 Widow Mines, 3 Marauders, 4 Ghosts, 5 Marines, 1 Supply Depot, and 2 SCVs). The game was played on "Eternal Empire LE" (Twitch VOD).
Worker slayer
Soul (T) has killed 220 Namshar's Drones
on "Ever Dream LE" and was victorious.
(Twitch
VOD).
Wins by country

This time South Korea was less dominant relative to IEM. Map wins:
| South Korea | Poland | Finland | Sweden | Germany | Italy |
| Innovation: 15 | Elazer: 14 | Serral: 17 | SortOf: 8 | Heromarine: 5 | Reynor: 11 |
| Solar: 11 | Soul: 7 | Namshar: 5 | Lambo: 3 | ||
| Soo: 9 | Mana: 6 | Showtime: 3 | |||
| Cure: 9 | Gungfubanda: 1 | ||||
| Dream: 7 | |||||
| Zest: 3 | |||||
| Bunny: 1 | |||||
| True: 1 |
Unit usage
This primarily shows in how many games certain unit types were made. For example in TvZ, 100% games had Zerglings, but Brood Lords were only in 2.2% games. Unit types are sorted by this percentage.
The other number is the typical amount of given unit type. For example, 30.4% games showcased Ultralisks in TvZ, and in those games the median number of Ultralisk made is 7.


Upgrade and research timings
Following charts show the typical upgrade and research timings for each non-mirror matchup. Mirrors are on my page, as well as the option to see how many times upgrades were researched when hovering mouse over the upgrade (total number & game fraction).


Unit COST-Efficiency
I like these charts even if they don't directly tell whether a unit is good or not. Some units will inevitably have a high score due to their different design (e.g. Swarm Hosts). On the other side, melee and other front-line units will have low scores.
This chart is just for TvZ. Other matchups can be found in this imgur album. There is exceptionally high Swarm Host cost-efficiency in ZvP. We saw Swarm Hosts in 8.6% ZvP games, and they used on average their Spawn Locust ability 4.28-times during their life. There weren't enough data for Swarm Hosts in TvZ.

Workers lost
These charts show median workers lost per matchup. Median values are shown for games with any result, wins only and losses only. It's interesting that Terrans lost on average more workers whether they won or lost compared to Zerg. Was there a strong focus on Zerg harassing?


Economy and army
Now let's look at average mining rate and army value for given matchup. Averages for longer games don't tell us much due to a small sample size, but averages under 20 minutes gives us some hint on how armies and economies boom.


Cost-effectiveness
Total values of units and structures destroyed/lost were calculated for each game. Following charts are comparing them between matchups and for different game outcomes.
In TvZ and PvZ, the Zerg has high median cost-efficiency compared to Terran and Protoss. However, that's skewed by higher than average winrates for Zerg. If we look at just games with either losses or wins for both races, cost-efficiency is lower in both cases for Zerg – as is expected due to its racial design.
It's TvP that is surprising. There Terrans pulled significantly ahead of Protoss. At IEM this matchup was quite even in cost-effectiveness.


Proxy locations
Now for winrates of games that started with proxy Barracks, Stargates or
Photon Cannons.
| Proxy winrates for non-mirror matchups | ||||||||
| matchup | Barracks | games | matchup | Cannon | games | matchup | Stargate | games |
| TvZ | 50% | 8 | PvZ | 0% | 2 | PvZ | 100% | 1 |
| TvP | 50% | 4 | PvT | - | 0 | PvT | - | 8 |
We can also see proxy locations on Ever Dream LE. Proxy locations for other maps are in this imgur gallery. If you want to see which players were in the games with proxies, and who won, you can see that on my other site.

Other notes
- There wasn't a high number of games, so don't take the stats as too indicative of the current state of the game.
- Previous post: IEM in numbers
- On the page analysis.maguro.one, there are more charts and more ways to filter the data. It's now on its own server, I'm slowly improving it, and trying out new stuff. It's a good learning experience.


